


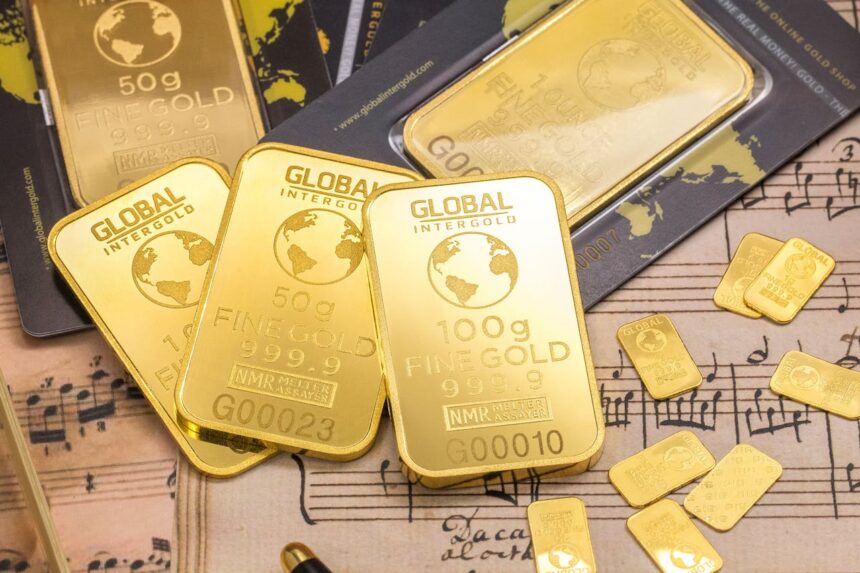
In the spring of 1980, gold was trading above $800 an ounce. Investors who had ridden the metal from $35 in 1971 felt, for a brief season, like they had discovered something the rest of the world had missed. Then Paul Volcker raised the federal funds rate to nearly 20 percent, inflation broke, and gold lost a substantial portion of its value, commonly estimated at more than half over the following two years. Some of those investors never came back.
That story matters right now. The World Bank’s 2026 Commodity Markets Outlook named precious metals the top-performing commodity class of the year, projected to rise 42 percent, more than double the next-best category, energy, which the report cited as the next-best performing category.
Base metals also posted gains, according to the report. Agricultural goods declined, according to the report. Gold reached historically elevated levels above $4,000 per ounce in the months leading up to May 2026. Silver did something even more striking: it posted a dramatic year-over-year gain. The last time either metal posted numbers like these was 1979.
And here’s the thing, analysts aren’t just noticing the resemblance. They’re saying it out loud.
What 1979 Looked Like From the Inside
In 1979, the world felt like it was coming apart at the seams. The Iranian Revolution had cut off a major oil supplier. The Soviet Union invaded Afghanistan in December of that year. Inflation in the United States was running in double digits, approaching its highest levels in decades. The dollar looked shaky. Into that uncertainty, investors poured money into gold and silver. The Hunt brothers, a Texas oil family, famously tried to corner the silver market, driving silver from roughly $6 an ounce to nearly $50 between 1979 and early 1980.
The logic made sense, as it always does in retrospect. Hard assets hold value when paper money doesn’t. Gold doesn’t default. Silver doesn’t lie.
What investors in 1979 couldn’t fully price in was the policy response. Volcker arrived at the Federal Reserve in August of that year, confirmed as chairman by the Senate, and took office on August 6, 1979, with a single mandate: kill inflation. He did. The rate hikes that followed were brutal enough that a recession arrived before the medicine finished working. When inflation broke, the fear premium that had been baked into gold prices broke with it. The metal spent most of the 1980s and 1990s in a slow, grinding decline that felt, to many who had bought near the top, like a betrayal.
The Supply Story Silver Isn’t Telling Loudly Enough

The 2026 situation shares the fear-driven demand side of 1979. But silver has something else going on underneath it. According to figures cited by GoldSilver.com, silver has been in a structural supply deficit since 2021. The cumulative shortfall from 2021 through 2025 approached 800 million ounces. That’s not a sentiment number. It’s a physical gap between how much silver the world mines and refines versus how much industry and investment actually consume.
Solar panels use silver. Electric vehicles use silver. Defense and semiconductor manufacturing use silver. Demand from those sectors has grown in ways that mines simply have not kept pace with. So even if the fear premium that drove silver up 126 percent were to fade tomorrow, the underlying supply arithmetic would still be pulling in one direction.
Gold’s situation is different but no less striking. Central banks now hold approximately 37,000 tonnes of gold, roughly 18 percent of all the above-ground gold that has ever been mined. BRICS nations controlled roughly 50 percent of global gold production as of late 2025. When the countries doing the mining are also the countries building alternatives to the dollar-based financial system, the political dimension of the gold trade stops being abstract.
Goldman Sachs projected gold at $4,900 per ounce by December 2026. Yardeni Research put out a more aggressive target of $6,000. Both numbers would have sounded like science fiction eighteen months ago.
The Question 1979 Actually Answers

History doesn’t repeat itself, but it tends to rhyme in ways that are worth listening to. The 1979 rally ended not because the world became less dangerous, but because the policy response to inflation proved more aggressive than anyone expected. Volcker’s rate hikes didn’t just slow the economy. They reset the entire framework through which investors thought about risk.
The open question in 2026 is whether a similar reset is coming. Inflation is not running at 1979 levels in most developed economies, but the dollar’s reserve currency status is under more deliberate, organized challenge than it was then. Central bank gold buying has been persistent and strategic rather than reactive. And the silver deficit is structural in a way that the Hunt brothers’ speculative corner never was.
What 1979 teaches, if you’re willing to sit with the uncomfortable part of the lesson, is that the most dangerous moment for a precious metals investor is when the thesis feels most obvious. In early 1980, everyone knew gold was going up. The consensus was so total that questioning it felt foolish. Then it stopped.
None of that means the 2026 rally ends tomorrow. The World Bank’s numbers are real. The supply deficit in silver is real. The central bank accumulation is real. But so is the history of what happens when hard-asset manias collide with a sufficiently determined policy response.
The investors who came out of 1979 best weren’t the ones who bought the highest and held longest. They were the ones who understood, from the beginning, exactly what they were betting on, and who set the terms of their exit before the crowd did.
<h3>Sources</h3>
<ul class=”article-sources”>
<li><a href=”https://goldsilver.com/industry-news/article/world-bank-precious-metals-surge-42-this-year/” rel=”noopener noreferrer”>GoldSilver.com. World Bank Precious Metals Surge Report</a>, Primary source for World Bank April 2026 Commodity Markets Outlook figures, silver supply deficit data, and price projections</li>
</ul>
This article was researched, written, and edited by our human editorial team. AI tools were used in a limited research-assistant capacity. All claims were independently verified.